Knowledge Base Articles
Related posts
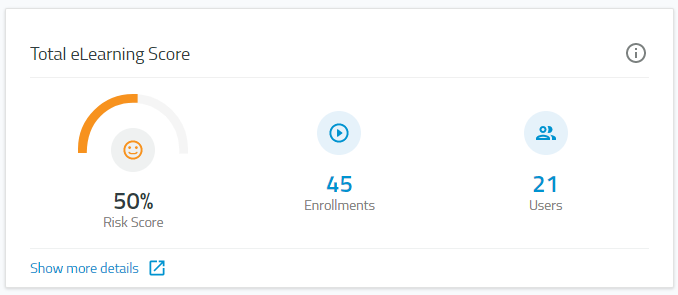
Generating the Risk Score Card
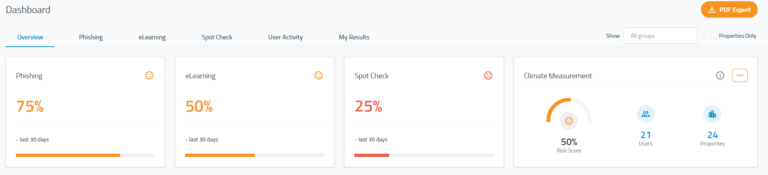
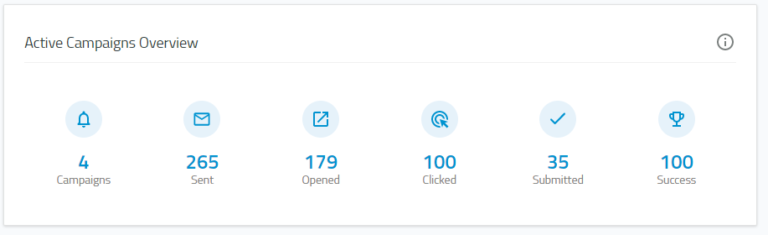
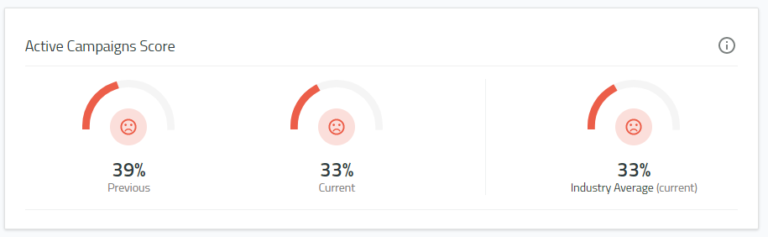
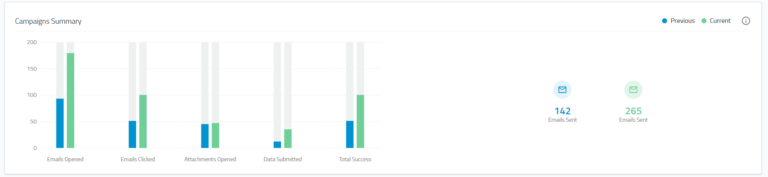
Navigating the VENZA System™ Dashboard
Accessing The New VENZA System™
Generating the Executive Summary
Bulk-Upload Multiple New Users
Certifying Group Training Attendees
Generate the Phishing Simulation Report
Phishing Simulations with VENZA
How to Run the Training Percentage Report
Set up Auto-Reports in VENZA Peak