VENZA Help

Related posts

How to Assess Your Team’s Training Progress

The Training Percentage Report (or TPR for short) will allow you to assess the overall compliance of your teams. Moreover, you can also generate the Training Percentage Report to review who on your team is currently compliant and who still needs to complete their training. 

This report is customizable and can be viewed with respective levels: property, department, or with the end user included. You can also schedule an auto-report based on your personal preferences and have the report delivered to you based on your chosen frequency!

To generate the Training Percentage Report:

  1. Navigate to the Manage drop-down menu

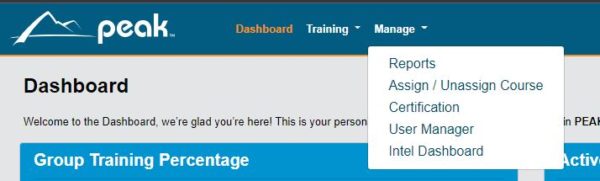
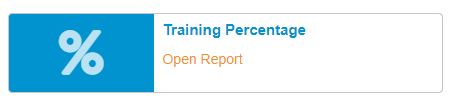
  2. Next, choose Training Percentage from the selection

  3. In the Filter section, make sure that the box for Group is checked

    Here your property will be displayed. You can click on Select group to navigate to a specific location or department.
    You can also use the next drop-down to modify how many levels are displayed within this report; if you leave this selection as All, your report will include departments and users

  4. On the right-hand side, Active is pre-select for the Status under the User filter

    This ensures that employees that have been inactivated will not misconstrue your compliance percentage.

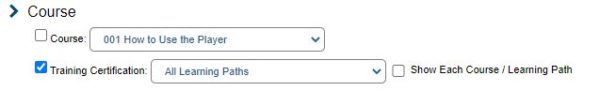
  5. Next, check Training Certification and select All Learning Paths in the drop-down
    If you wish to see a high-level report showing the overall compliance for your property or properties, click on Display results now.

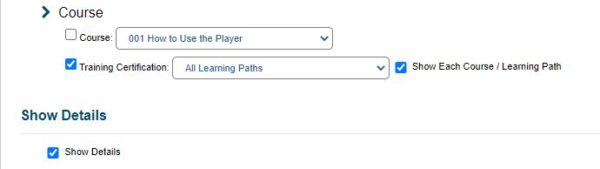
  6. If you wish to display information on your individual learners to see who is complete and who needs to take their training, check the box Show Each Course/Learning Path and Show Details

  7. Lastly, after applying the above filters, you can Export the report; if you want to do so, check the Export Result As box and make your selection

    You have the download option in Microsoft Word, Excel, or PDF, but we recommend the MS Excel version so that you may filter data if you desire

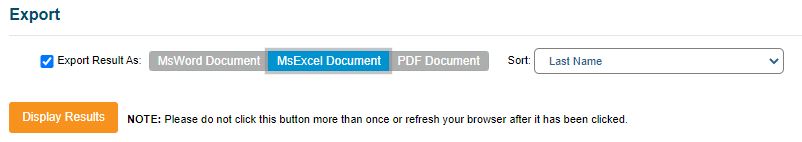
  8. Click the Display Results button

You can download the report in MS Word, Excel, or PDF. We recommend choosing MS Excel as it will allow data filtering.

Review your current training progress

In the bottom left-hand corner of your screen, your report will pop up if you have chosen the download; if you have chosen to Display Results without exporting, simply scroll down to view.

You will see the Training Percentage Report according to your selection in the Filter Where section with either option.

  • If left displaying All in the drop-down menu in Filter Where, you will see each department, each user in that department, and the learning path that user is assigned.
  • You will also see whether or not the training for an individual is complete (C) or incomplete (I)

Didn't find any solution?

Connect with us real time, drop us a line through the live chat, or give us a ring!